

(Updated on 17/09/2026)
Educational disclaimer: This article describes a trading strategy and chart setup for educational and informational purposes only. It is not financial advice, investment advice, or a recommendation to buy, sell or hold any financial instrument. The examples shown are for illustration and should not be interpreted as predictions or trading signals. Trading involves significant risk, and you can lose money. Past performance and historical examples do not guarantee future results. You should carry out your own research and consider whether trading is appropriate for your circumstances.
Trading charts can be overwhelming.
Candlesticks, moving averages, oscillators, trend lines, support and resistance, momentum indicators, volume and dozens of other tools can all compete for your attention. As a result, traders can end up with more information than they know how to process.
One alternative is the colour-coded approach to trading (also known as colour-coordinated trading or just the colour method).
The basic idea is remarkably simple: instead of interpreting each indicator separately, each colour represents the underlying market conditions. If several components of the chart are showing the same colour, the trader has a visual indication that Trend and Momentum are aligning.
Traders and educators have developed this approach in different forms, including Cynthia Macy and The Trading College.
Please note: The Cynthia Macy link above takes you to her five YouTube channels where you can see what she has made over the years, and the second link takes you to the Trading College’s YouTube page.
To go straight to their websites:
Cynthia Macy: day-trade-forex.com
Trading College: tradingcollege.co.uk
Although their systems are not identical, they share an important philosophy: make market information easier to interpret by turning complex information into clear visual signals. Cynthia’s own material describes colour-coded trading as using candles and indicators whose colours confirm a trend when they agree.
This guy, Trade Synper, also uses his own colour-coded system. See his YouTube channel to see it in action.
What is colour-coded trading?
Colour-coded trading is essentially a method of visualising market conditions.
Rather than looking at an indicator and having to remember whether a particular value means bullish, bearish, strengthening or weakening Momentum, the chart can communicate that information through colour.
For example:
- Green can represent bullish or long conditions.
- Red can represent bearish or short conditions.
- Other colours can identify retracements, consolidation or changing Momentum.
- When multiple indicators show the same directional colour, the trader has greater Confirmation.
Cynthia Macy’s colour-coded systems are built around this concept. Her systems use coloured trend candles and coordinated indicators so the trader can identify the prevailing Trend without interpreting numerous unrelated lines.
The Trading College has taken a similar visual approach with its Colour Method™, which it describes as a traffic-light-style system: green represents buying conditions, and red represents selling conditions.
The important point is that the colours aren’t supposed to be magic signals.
They are a visual language for market information.
Why use colours?
One of the central ideas behind Cynthia Macy’s approach is that traders can suffer from what she describes as input overload.
Imagine opening a conventional trading chart containing:
- several moving averages
- RSI
- MACD
- Bollinger Bands
- support and resistance
- trend lines
- candlesticks
- volume
- Fibonacci levels
Every component requires interpretation.
The trader then has to combine all of those pieces of information before making a decision.
Colour coding attempts to reduce that mental workload.
Instead of thinking:
“The moving average is bullish, RSI is above 50, MACD is positive, volatility is increasing and price is above resistance…”
the trader might visually see several components turning green.
That doesn’t eliminate analysis, but it can make the analysis much quicker.
Cynthia argues that colour coordination can reduce the information the conscious mind has to process, potentially making trading decisions easier and less stressful.
This is particularly interesting for discretionary traders because trading isn’t purely a technical exercise. Decision-making under uncertainty is also a psychological challenge.
The traffic-light concept
The Trading College’s modern Colour Method provides one of the simplest ways to understand the philosophy.
Think of the chart like a traffic light:
🟢 Green — Look for buys
Green indicates that the system is identifying bullish conditions.
The trader isn’t necessarily told to buy immediately just because something has turned green. Instead, green establishes the directional bias the trader should look for opportunities in.
🔴 Red — Look for sells
Red indicates bearish conditions.
Again, the purpose is to establish the direction in which the trader should be looking.
⚪ Other colours — Wait or interpret the market differently
Depending on the particular system, additional colours can represent things such as retracements, consolidation or uncertain/choppy conditions.
The Trading College’s own educational material, for example, describes seven candle colours, including different shades of green and red, blue and yellow retracement states, and white for choppy price action.
This creates an important principle:
Not trading can also be a signal.
If the chart is showing conditions that don’t meet the rules, there may be no reason to enter.
The first rule: identify the Trend
One of the strongest themes running through Cynthia Macy’s systems is the importance of identifying the broader Trend before looking for an entry.
Her Easy Colour Trend and Flat system, for example, uses coloured boxes to represent the daily Trend. The concept is that traders should generally look for setups in the direction of that larger Trend rather than continually attempting to predict reversals.
This can be thought of as a top-down approach.
For example:
Daily Trend → bullish
↓
4-hour Trend → bullish
↓
1-hour Trend → bullish
↓
Entry timeframe → bullish setup
When multiple timeframes agree, the market is displaying what traders often call confluence.
The opposite situation might be:
Daily → bullish
4-hour → bullish
1-hour → bearish
5-minute → bullish
That is much less straightforward.
The lower timeframe may simply be experiencing a temporary pullback within the larger bullish Trend.
This is where colour coding can become particularly useful.
Colour agreement across multiple timeframes
Multi-timeframe analysis is another important component of Cynthia Macy’s methodology.
Her systems include coloured multi-timeframe indicators that can show the direction of several timeframes simultaneously. In her Heaven For Everyone system, for example, four coloured dots represent different timeframes, allowing the trader to see whether multiple timeframes are aligned.
Imagine seeing:
M30 🟢
M15 🟢
M5 🟢
M1 🟢
That tells you that several timeframes are currently aligned bullishly.
Now imagine:
M30 🟢
M15 🟢
M5 🔴
M1 🔴
That could indicate that the market is experiencing a short-term retracement against the larger Trend.
If the lower timeframes subsequently return to green, the trader may have a potential re-entry into the existing Trend rather than needing to chase the original move.
This idea of entering after a retracement is particularly prominent in Cynthia’s Ultimate Fusion system. Her material explains that markets rarely move continuously in one direction and that retracements can provide opportunities to enter an established trend after the initial move has already begun.
Trading retracements rather than chasing price
One of the biggest problems traders face is entering after a market has already moved significantly.
Suppose a stock rises strongly:
100 → 105 → 110 → 115
A trader sees everything turning green at 114 and thinks:
“I need to get in.”
They buy at 115.
The market then retraces to 111.
The trader immediately feels that they made a mistake.
But the broader Trend may still be bullish.
The alternative approach is to wait for a pullback.
For example:
100 → 105 → 110 → 115 → 111 → 114 → 118
Rather than chasing the move at 115, the trader waits for the retracement toward 111 and then looks for evidence that bullish Momentum is returning.
This is one of the key concepts in Cynthia’s colour-coded retracement systems. Her Ultimate Fusion system specifically focuses on identifying the main Trend, waiting for retracements and then using colour-coded indicators to identify potential re-entry points.
Colour coding and Momentum
Colour alone isn’t the entire strategy.
The underlying indicators are still doing the analytical work.
Colour simply makes their output easier to interpret.
Cynthia’s systems have incorporated indicators such as:
- RSI
- Bollinger Bands
- MACD
- volatility measures
- trend indicators
- Fibonacci levels
- multi-timeframe trend indicators
- support and resistance
- supply and demand
- currency strength
For example, her Green Tomatoes system combines coloured Bollinger Band information with volume and RSI, with the idea that the colours should agree before an entry is considered.
This illustrates an important distinction:
Colour coding isn’t an indicator in itself.
It translates indicator output into something the trader can recognise quickly.
The importance of confluence
The real strength of the colour-coded concept is therefore not simply:
Green = buy.
It is:
Green + green + green + green = stronger confluence.
Suppose four separate components are being used to assess a trade:
| Component | Reading |
|---|---|
| Main Trend | 🟢 |
| Momentum | 🟢 |
| Short-term Trend | 🟢 |
| Entry confirmation | 🟢 |
The trader now has several pieces of evidence pointing in the same direction.
Compare that with:
| Component | Reading |
|---|---|
| Main Trend | 🟢 |
| Momentum | 🔴 |
| Short-term Trend | 🟡 |
| Entry confirmation | ⚪ |
There is clearly less agreement.
A disciplined trader might simply wait.
This is one of the most valuable aspects of a rule-based colour approach: it can tell you when not to trade.
Support and resistance still matter
Colour coding should not be viewed as a replacement for market structure.
A green signal appearing directly underneath major resistance is very different from a green signal appearing after a bullish breakout or from a recognised demand area.
Cynthia’s systems incorporate concepts such as key levels, Fibonacci levels and supply and demand. Her Green Tomatoes system, for example, describes trading from key levels and using other levels to determine potential targets and stop locations.
A useful way to think about the process is:
1. What is the larger Trend?
2. Where is price relative to important levels?
3. Is price trending, retracing or consolidating?
4. Is Momentum supporting the move?
5. Are the colours aligned?
6. Is the potential reward worth the risk?
Only when enough of those factors agree should a trade become interesting.
The Trading College approach
The Trading College has developed its own version of this philosophy through the Colour Method™.
Its current educational material describes the method as a rule-based system intended to simplify trading decisions, with green representing long/buy conditions and red representing short/sell conditions.
Its Pro Trading System also combines visual signals with features designed to identify trends, entries, stop-loss locations and position sizing.
The Trading College’s approach therefore extends the colour concept beyond simply identifying direction.
It attempts to create a complete trading framework:
Direction → Setup → Entry → Stop → Target → Position size → Exit
That matters because a trading strategy isn’t complete just because it tells you when to buy.
You also need to know:
- where you are wrong
- how much you are risking
- where you might take profit
- how large the position should be
- when to exit
- when not to trade
The Trading College explicitly incorporates risk management and trading psychology into its Colour Method education.
A simple example
Imagine you’re trading a currency pair.
The daily chart is green.
The 4-hour chart is also green.
The 1-hour chart has temporarily turned red because price is pulling back.
Rather than immediately selling because the 1-hour chart is red, you recognise that the larger Trend remains bullish.
You wait.
Eventually the 1-hour chart turns green again.
You then look for additional Confirmation:
- price is near a support or demand area
- momentum is recovering
- the lower timeframe turns bullish
- the potential reward is sufficiently large compared with the risk
You now have a potential trend-continuation trade.
The sequence looks like this:
Major Trend 🟢
↓
Retracement 🔴
↓
Retracement reaches support
↓
Momentum improves
↓
Lower timeframe returns 🟢
↓
Entry
This is very different from simply buying every time a candle turns green.
What about red and green candles?
Don’t confuse colour-coded trading with ordinary candlestick colours.
Traditional candlestick charts commonly use green or white candles for bullish price movement and red or black candles for bearish movement.
Colour-coded systems go further.
The colour may represent the calculated condition of an indicator or combination of indicators, rather than simply whether that individual candle closed higher or lower.
This distinction is crucial.
A normal green candle simply tells you something about that candle’s open and close.
A colour-coded trend candle may attempt to communicate something about the underlying Trend or Momentum.
That is why Cynthia’s systems use smoothed trend candles and coordinated indicator colours rather than relying solely on conventional candle colours.
Currency strength adds another layer.
For forex traders, colour coding can also be applied to currency strength.
Cynthia Macy has developed a Currency Strength Meter designed to identify relatively strong and weak currencies.
Her meter uses colours to make relative strength easier to recognise at a glance. For example, her published system describes blue as very weak, yellow as weak, orange as strong and red as very strong.
The idea is straightforward.
If one currency is particularly strong and another is particularly weak, their currency pair may be worth investigating.
But Cynthia also makes an important point: currency strength should not be used by itself to automatically enter a trade.
Consider other technical factors for timing.
That is another example of the broader colour-coded philosophy:
Use colour to narrow the field, then use Confirmation to make the decision.
The biggest mistake: treating colour as a guarantee
This is perhaps the most important warning.
A green signal does not mean that price must rise.
A red signal does not mean that price must fall.
Markets are probabilistic.
Indicators are derived from market data. They cannot know what will happen next.
A colour-coded system can help you structure decisions, but it cannot eliminate uncertainty.
The Trading College itself states that trading involves risk and that past performance isn’t indicative of future results.
Therefore, the correct interpretation is:
Green = conditions that may favour a long trade.
Not:
Green = guaranteed profit.
That distinction separates a trading system from gambling.
Risk management remains the foundation.
Even a strategy with a genuine statistical edge can lose money.
Suppose a system wins 60% of trades.
That means approximately 40% of trades could still lose.
And losing trades can occur consecutively.
This is why position sizing is so important.
A trader risking 1% of their account on each trade can withstand a losing streak much more easily than someone risking 10%.
For example:
£10,000 account
Risk per trade = 1%
Maximum planned loss = £100
That means a stop-loss should be positioned and the position size calculated so that the predefined loss is approximately £100 if the stop is reached.
The colour signal comes first in the sense of identifying a potential opportunity.
Risk management determines whether you can afford to take it.
Colour coding and trading psychology
Perhaps the most interesting part of this approach isn’t technical at all.
It’s psychological.
A trader can know exactly what they should do and still fail to do it.
They might:
- enter too early
- close winners too quickly
- move their stop
- revenge trade
- overtrade
- trade because they are bored
- increase their position after a loss
- ignore their own rules
A visual system can potentially help by making the decision process more objective.
Instead of asking:
“Do I feel like buying this?”
the trader asks:
“Does this setup meet my rules?”
That is a major shift.
The goal isn’t to remove emotion completely.
The goal is to stop emotion from becoming the trading system.
The Trading College similarly places considerable emphasis on discipline, psychology, routine and risk management alongside the Colour Method.
A practical colour-coded trading checklist
A trader using this philosophy could structure a setup like this:
1. Establish the major Trend
Is the higher timeframe bullish, bearish or ranging?
2. Identify the market condition
Is price:
- trending?
- retracing?
- breaking out?
- consolidating?
3. Check the colours
Are the relevant indicators agreeing?
4. Look for confluence
Do Trend, Momentum and price location support the same idea?
5. Identify the entry
Wait for the predefined entry condition rather than entering simply because the chart looks attractive.
6. Define the stop
Know exactly where the trade is invalidated.
7. Define the target
Identify the logical profit objective before entering.
8. Calculate position size
Size the trade according to your predetermined risk.
9. Execute
Take the trade only if all required conditions are present.
10. Leave the trade alone
Once the trade is active, follow the plan rather than reacting emotionally to every candle.
Why the approach appeals to traders
The attraction of colour-coded trading is obvious.
It attempts to transform something complicated into something visually intuitive.
Instead of seeing:
20 pieces of information
the trader may see:
🟢 Trend
🟢 Momentum
🟢 Confirmation
🔴 No trade
That simplicity can be particularly attractive to newer traders.
But simplicity shouldn’t be confused with ease.
A simple trading system can still require considerable discipline.
In fact, the technical complexity is reduced; the trader may have nowhere left to hide.
If the rules say no trade, you have to wait.
If the stop is hit, you have to accept the loss.
If the setup isn’t there, you have to stay out.
That is where the real skill begins.
Cynthia Macy and The Trading College: the common philosophy
Cynthia Macy and The Trading College should not be treated as though they have one identical trading system.
They have developed their own systems, indicators, terminology and educational frameworks.
However, there is a clear conceptual overlap.
Cynthia’s work places strong emphasis on:
colour + trend + volatility + momentum + multi-timeframe confirmation + retracements
while The Trading College’s Colour Method emphasises:
visual signals + structured entries + risk management + discipline + repeatable execution.
The common idea is powerful:
Make the market easier to read by converting complex information into a consistent visual framework.
That is arguably the real value of colour-coded trading.
It isn’t about finding a magical colour that predicts the future.
It’s about creating a language for market conditions.
How I developed my systems based on Cynthia Macy’s work and other resources to look at
The colour-coded trading strategy represents a different way of thinking about technical analysis.
Instead of covering a chart with unrelated indicators and attempting to interpret each one individually, the trader creates a coordinated visual system.
Green can mean bullish.
Red can mean bearish.
Other colours can identify retracements, consolidation or changing Momentum.
When multiple components agree, the trader has confluence.
When they disagree, the trader can wait.
And that final point may be the most important.
A good trading system doesn’t just tell you when to trade. It should also tell you when not to trade.
Cynthia Macy’s work demonstrates how colour coordination can be used across Trend, volatility, Momentum, retracements, and multiple timeframes.
The Trading College has developed its own Colour Method around a similarly visual philosophy, combining colour-coded signals with structured trading education, risk management and psychology.
Ultimately, however, the colours are only a tool.
The edge comes from the rules behind them, the quality of the testing, the consistency of execution and—most importantly—the trader’s ability to manage risk.
Trading is inherently risky, and no colour-coded system can guarantee profitable results. The objective should therefore be to use the method as a structured decision-making framework, test it thoroughly on historical and demo data, and risk only capital you can genuinely afford to lose.
Green doesn’t guarantee a winner. Red doesn’t guarantee a loser.
The purpose of the colour is simply to make the decision clearer.
The systems that I have put together using the colour-coded method
Here are four systems that I have put together, or adapted from Cynthia Macys work on MetaTrader 4, MetaTrader 5, CTrader and TradingView
Here’s a video of MetaTrader 4, MetaTrader 5, and CTrader in action. I put together the TradingView system after making this video.
I didn’t program or create any of the indicators on any of the platforms; I simply bought or downloaded them for free, then adapted and refined them.
The indicators on MT4 and MT5 are the ones Cynthia Macy made. Sadly, she no longer sells them on her website, day-trade-forex.com, which she shut down a while ago.
Please note: The systems described in this article are my own adaptations and combinations of ideas, techniques and tools that I have studied from various sources. They should not be regarded as official Cynthia Macy or Trading College systems, and I am not suggesting that either is responsible for, endorses, or recommends the particular combinations and configurations I describe here.
The video shows the colour-coded/coordinated trading strategy that I have built on CT Trader (left), MetaTrader 5 (middle), and MetaTrader 4 (right) on the 1-minute Gold/USD chart.
Action starts around the 5-minute mark in the video. Feel free to set the video to 2x speed.
The approach can potentially be applied to different instruments and timeframes, although its effectiveness may vary, and each combination should be tested separately.
The systems use trend candles and other indicators that work together to help identify potential entry and exit conditions.
FYI, I have looked at pretty much every other kind of trading strategy, including:
Footprint chart
Volume profile
Moving averages
Head and Shoulder patterns
Bookmap trading
Harmonic Scanner
Candle patterns
and hundreds and hundreds of indicators, and found this to be one of the simplest ways for me to interpret the markets and organise the information on my charts.
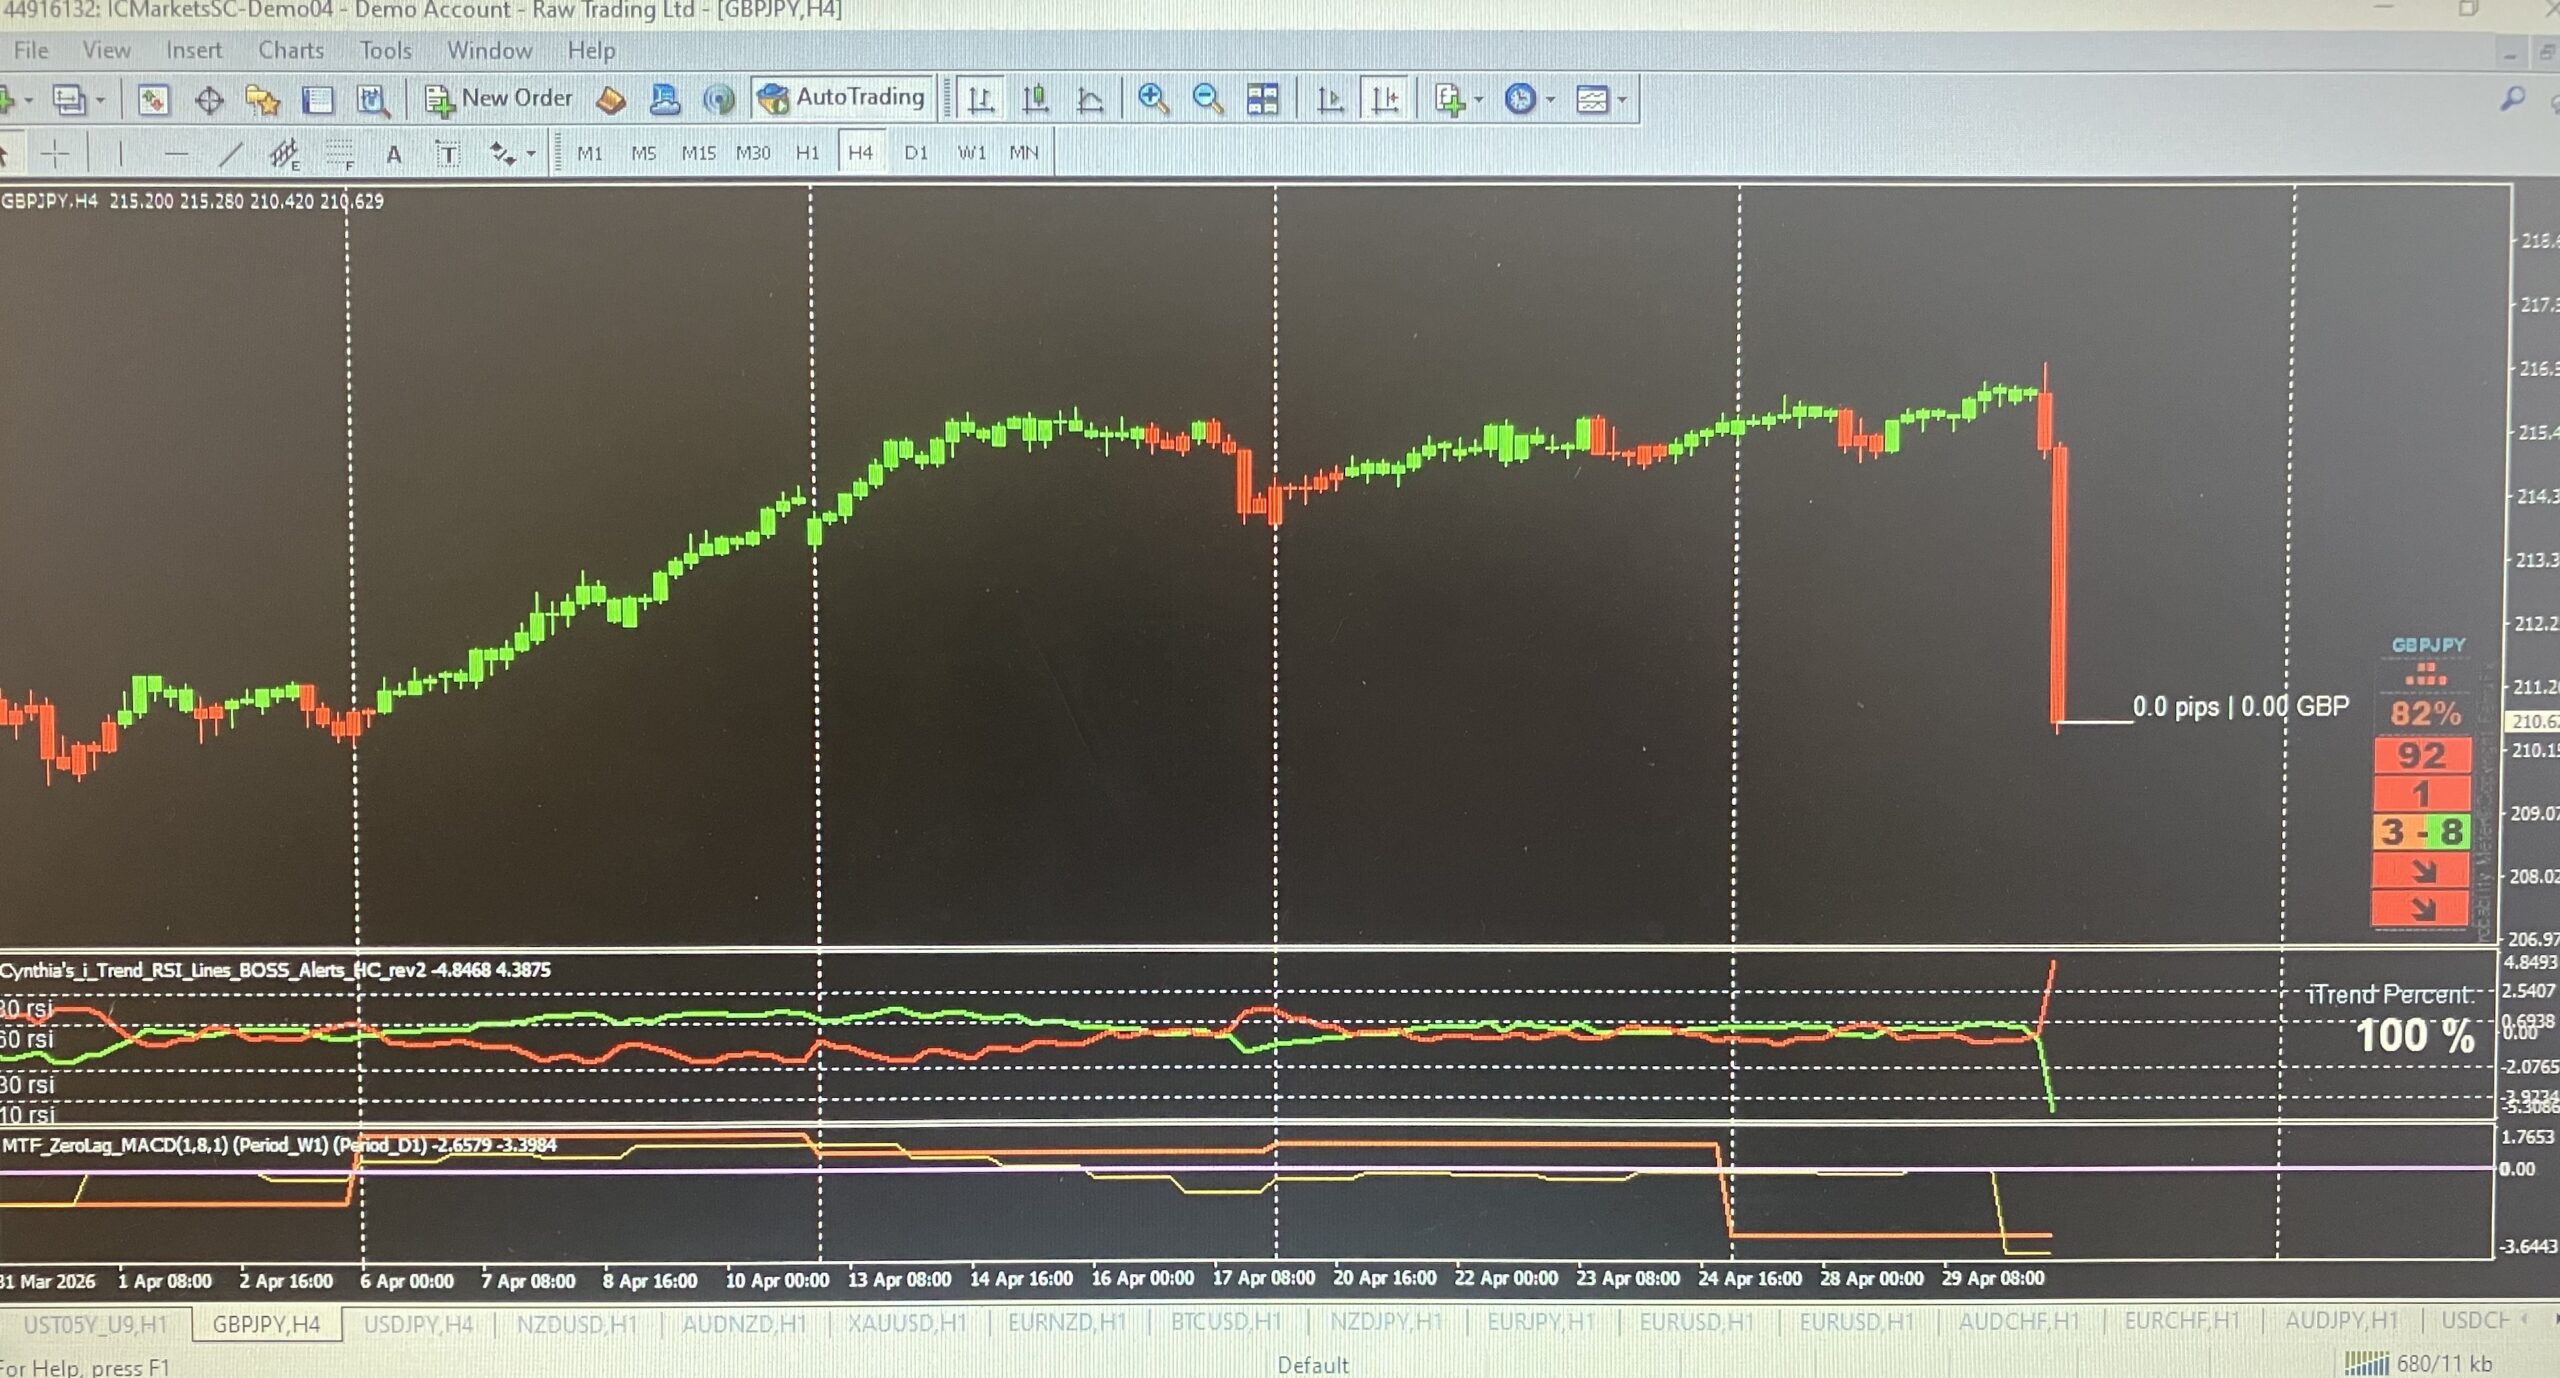
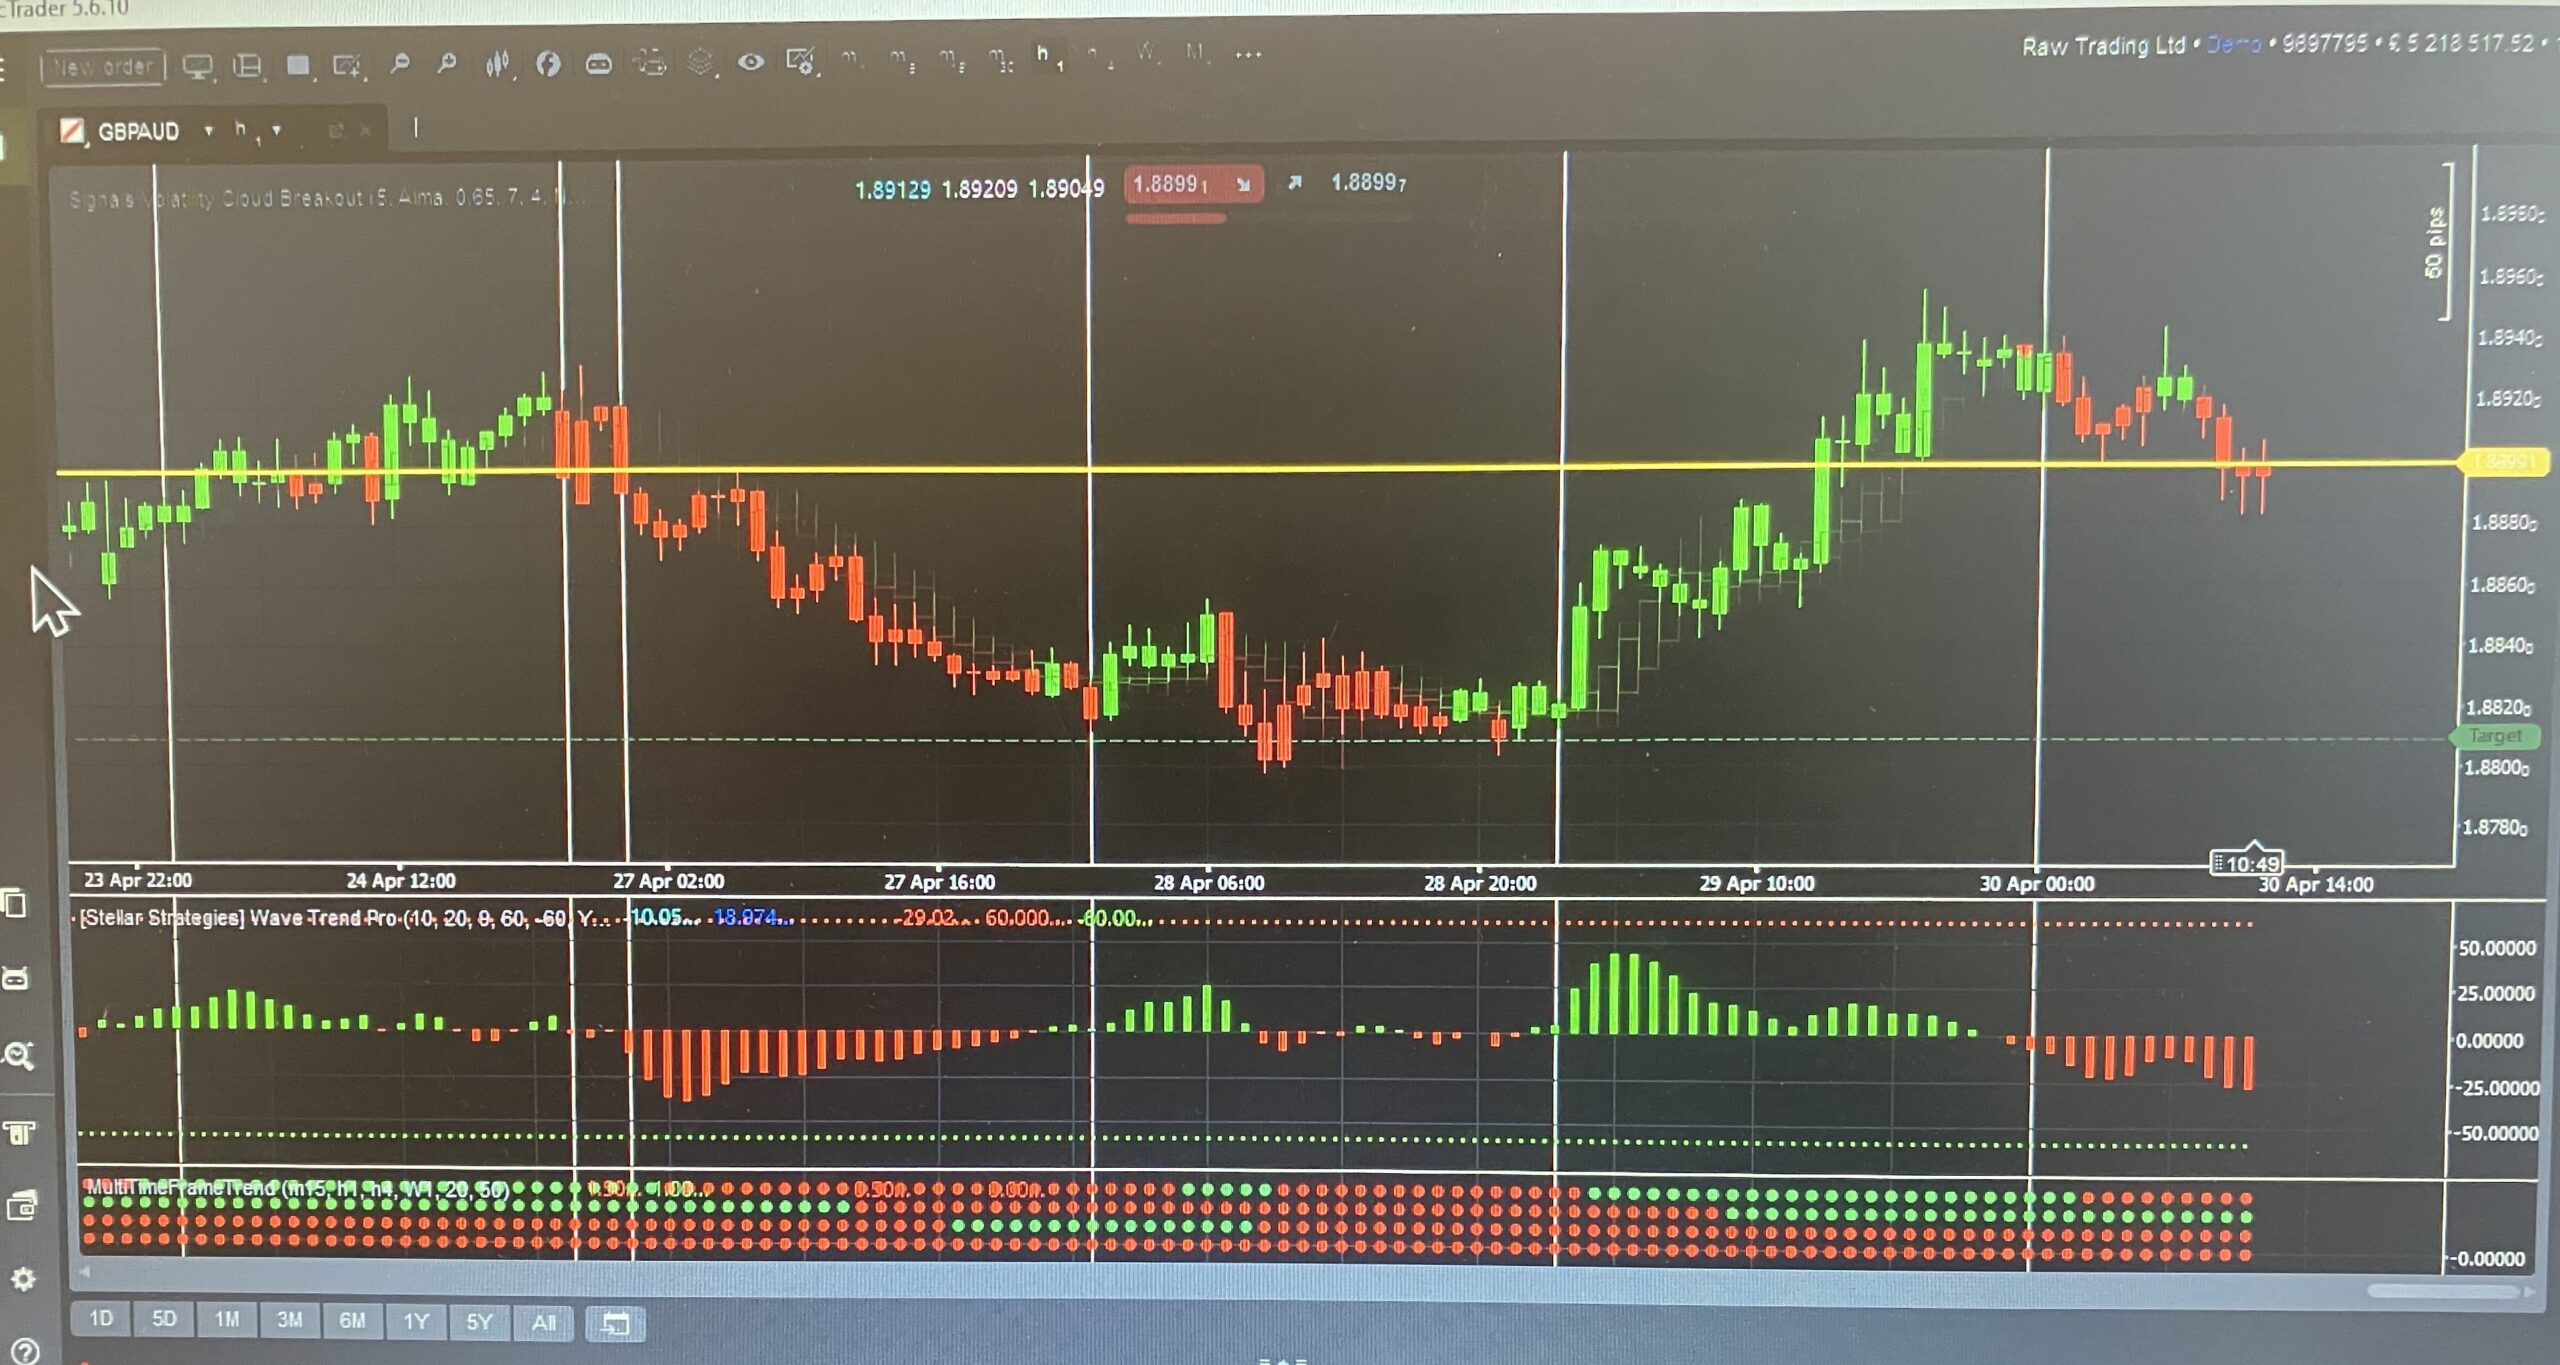
As you can see in the four diagrams below, they also show Gold/USD, but this time on the 4-hour chart across all four trading platforms. See how much easier it is to read the charts. Each chart has only three indicators.
The green and red lines I added illustrate potential entry and exit areas identified by the system.


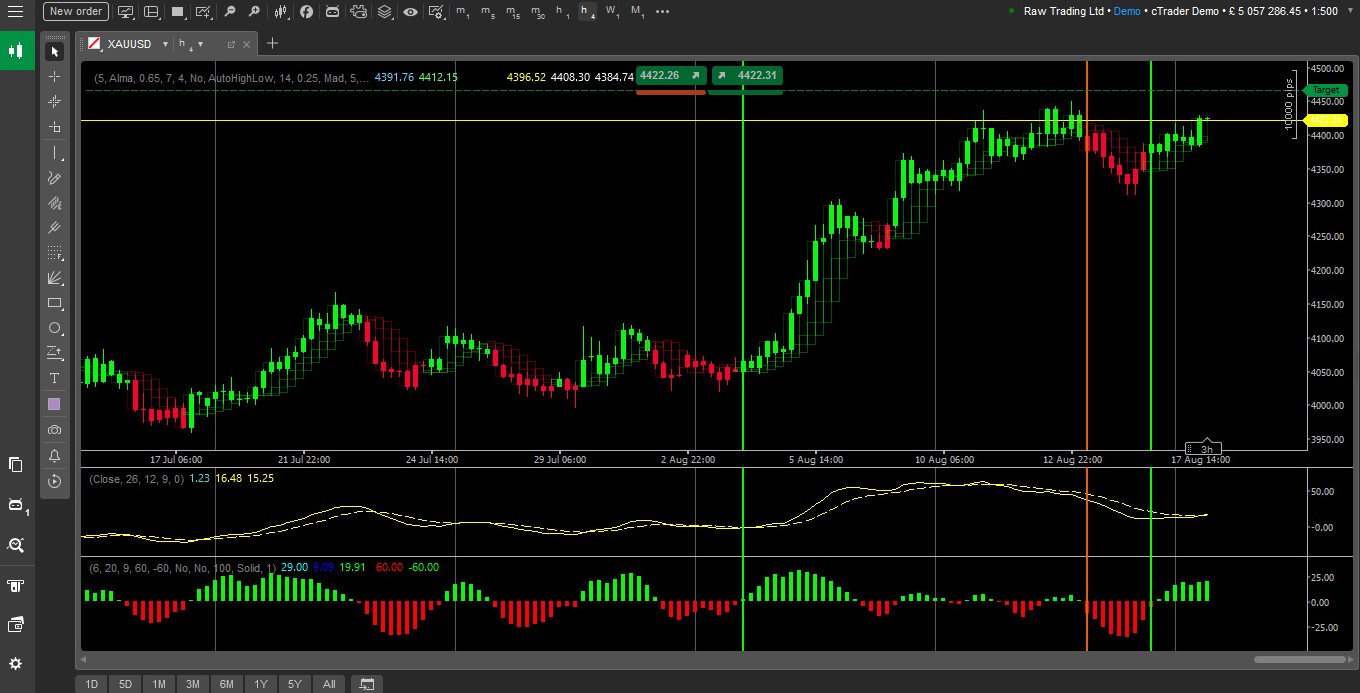

In the near future, I will add more resources and try to get the indicators for you to download. In the meantime, try building your own, or get the one from Trading College.
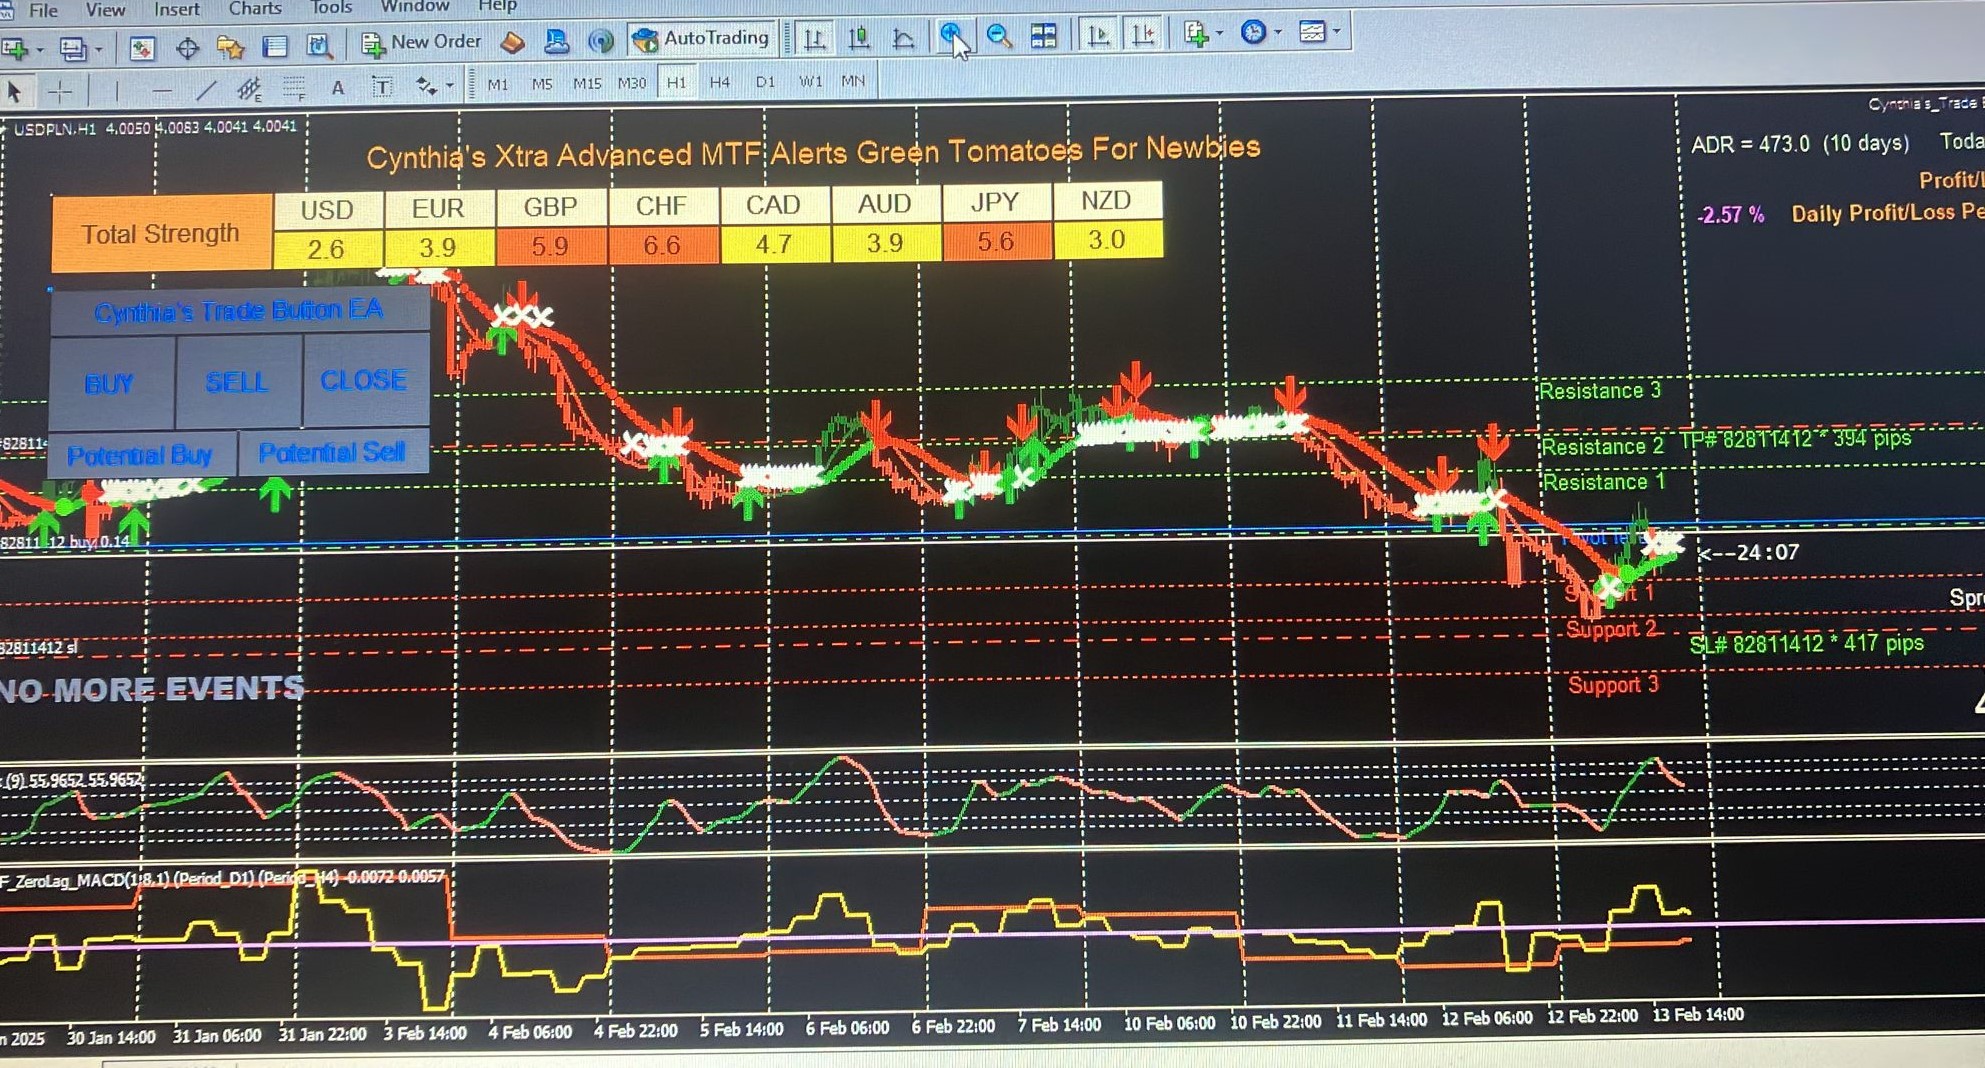
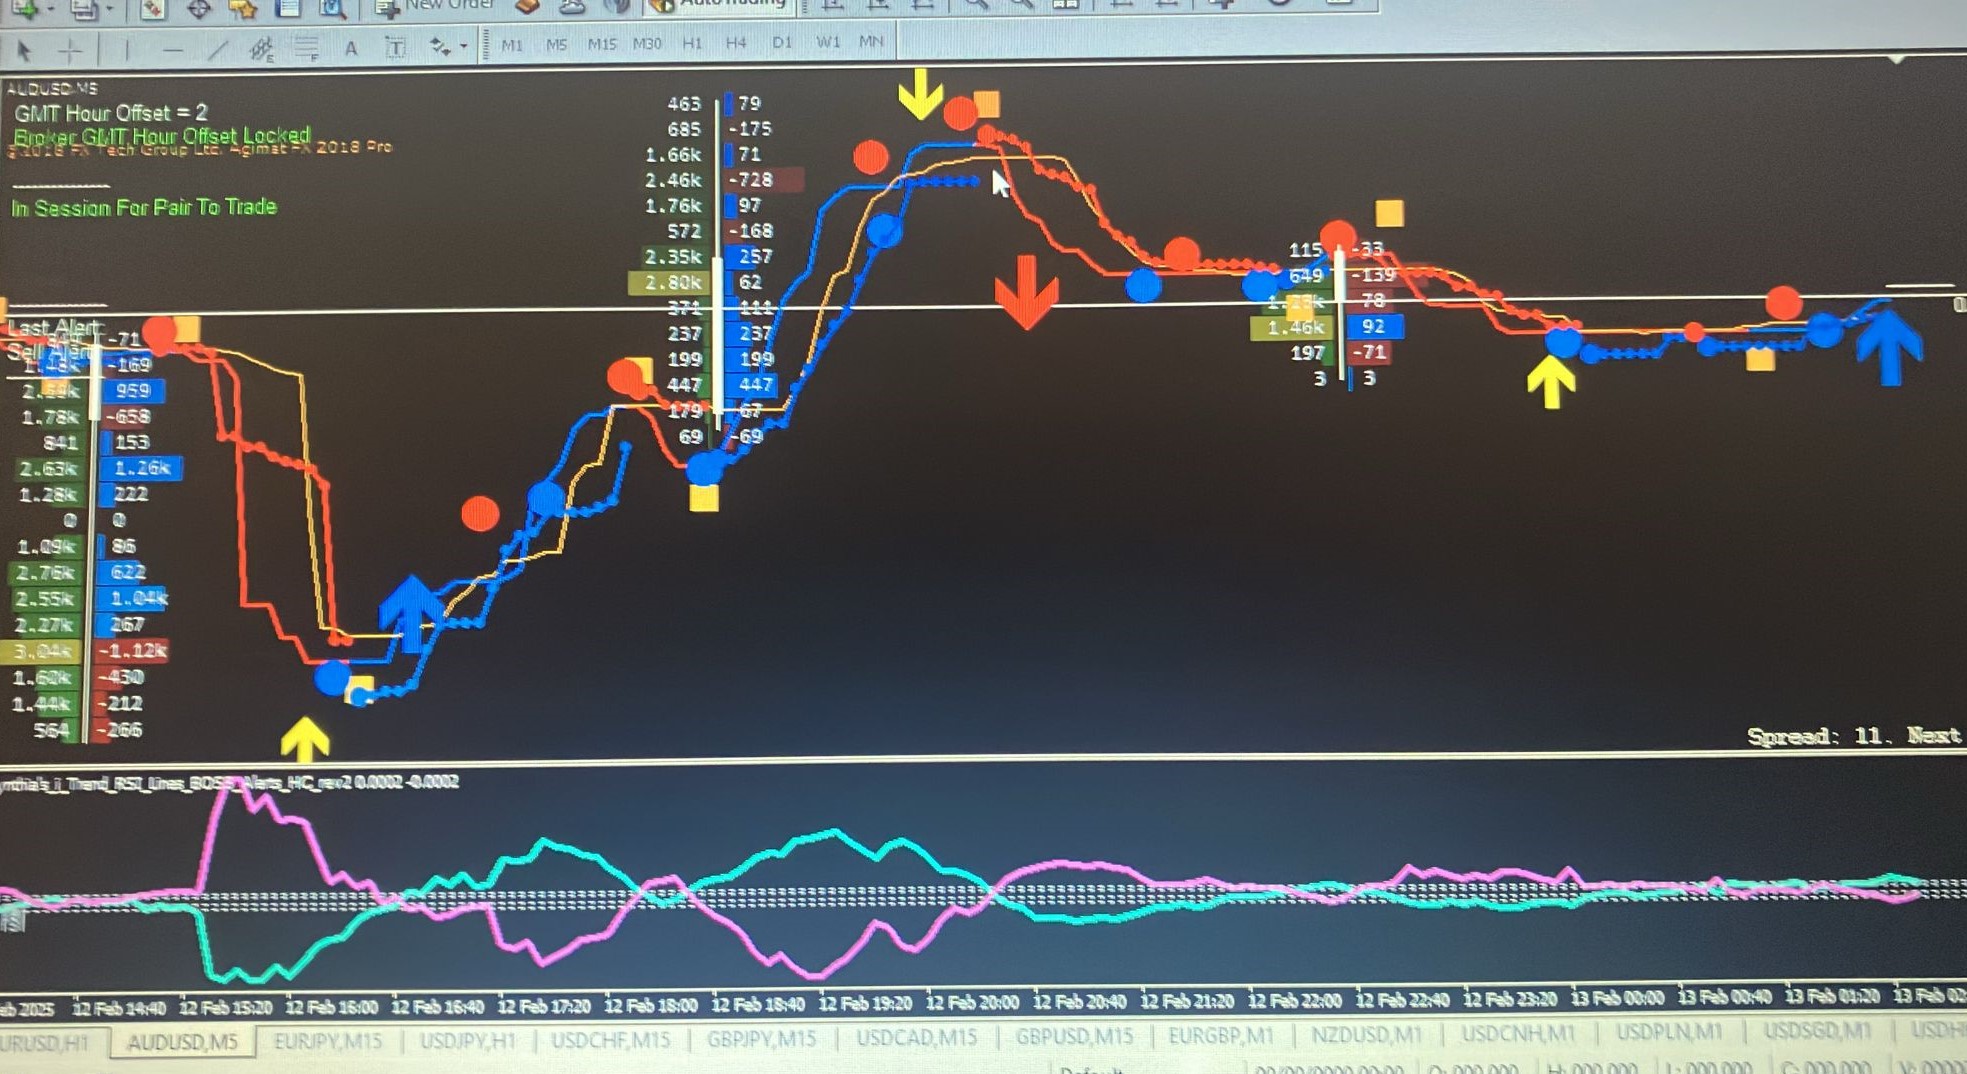
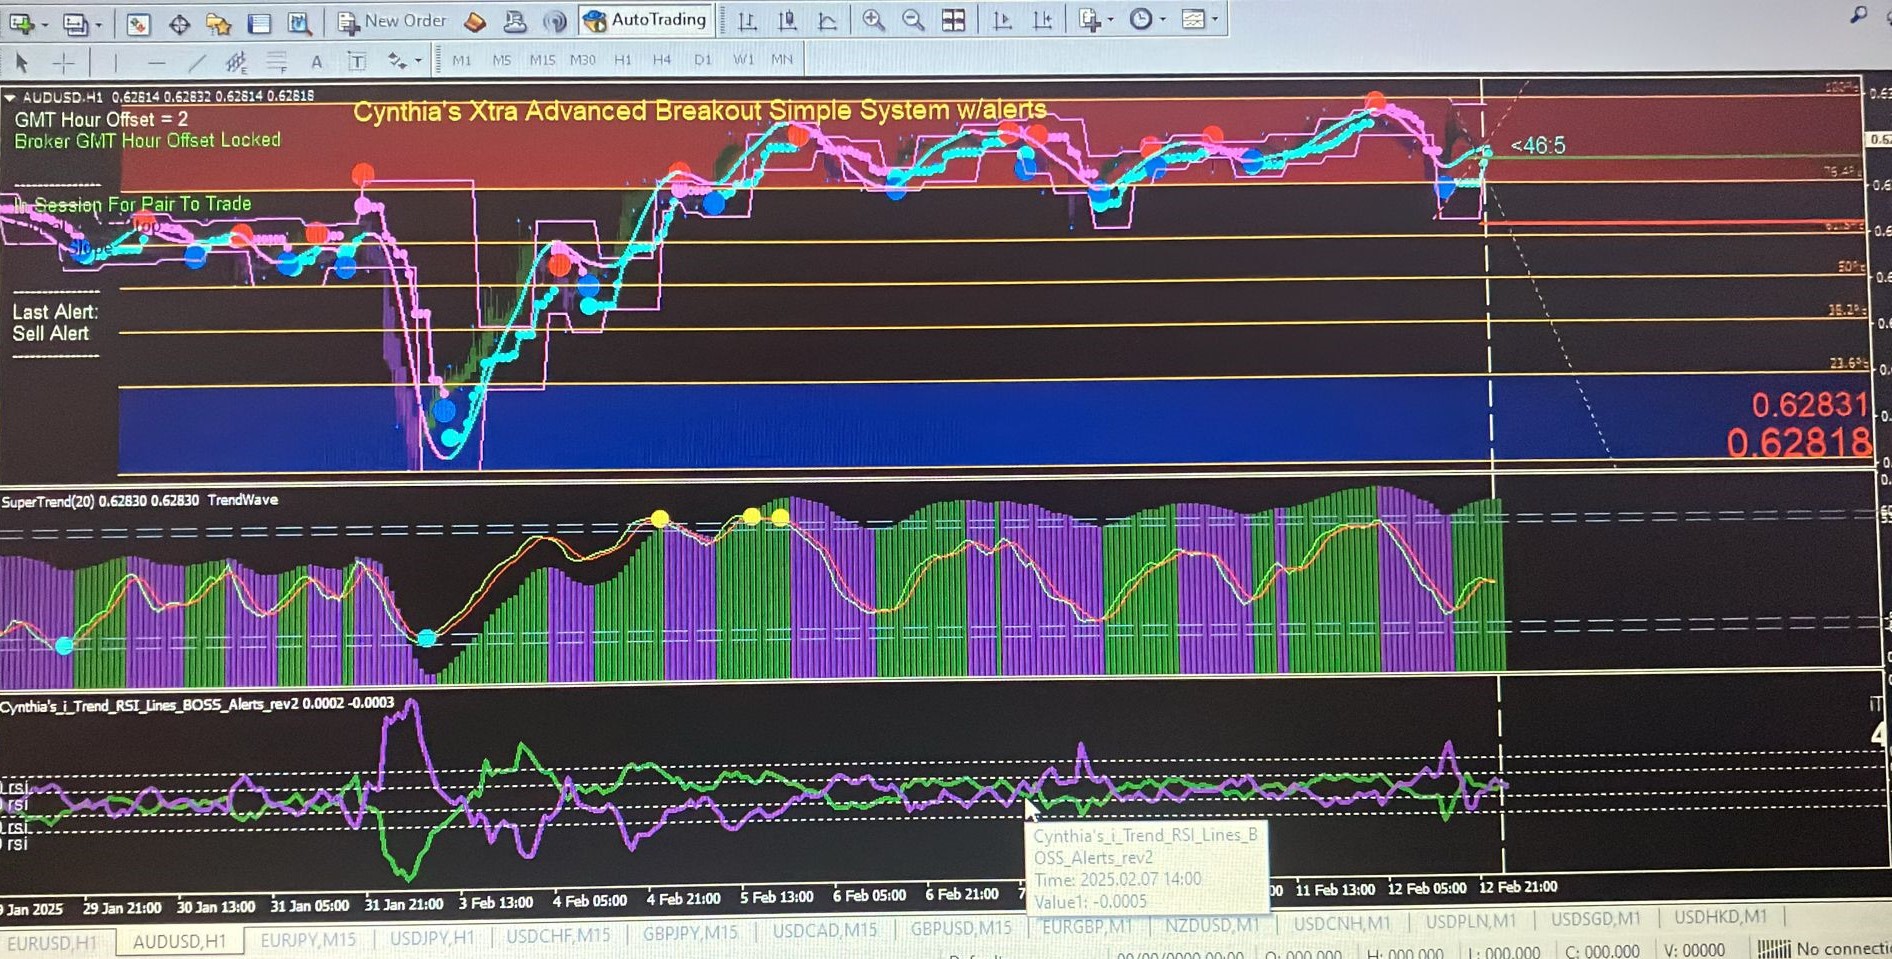
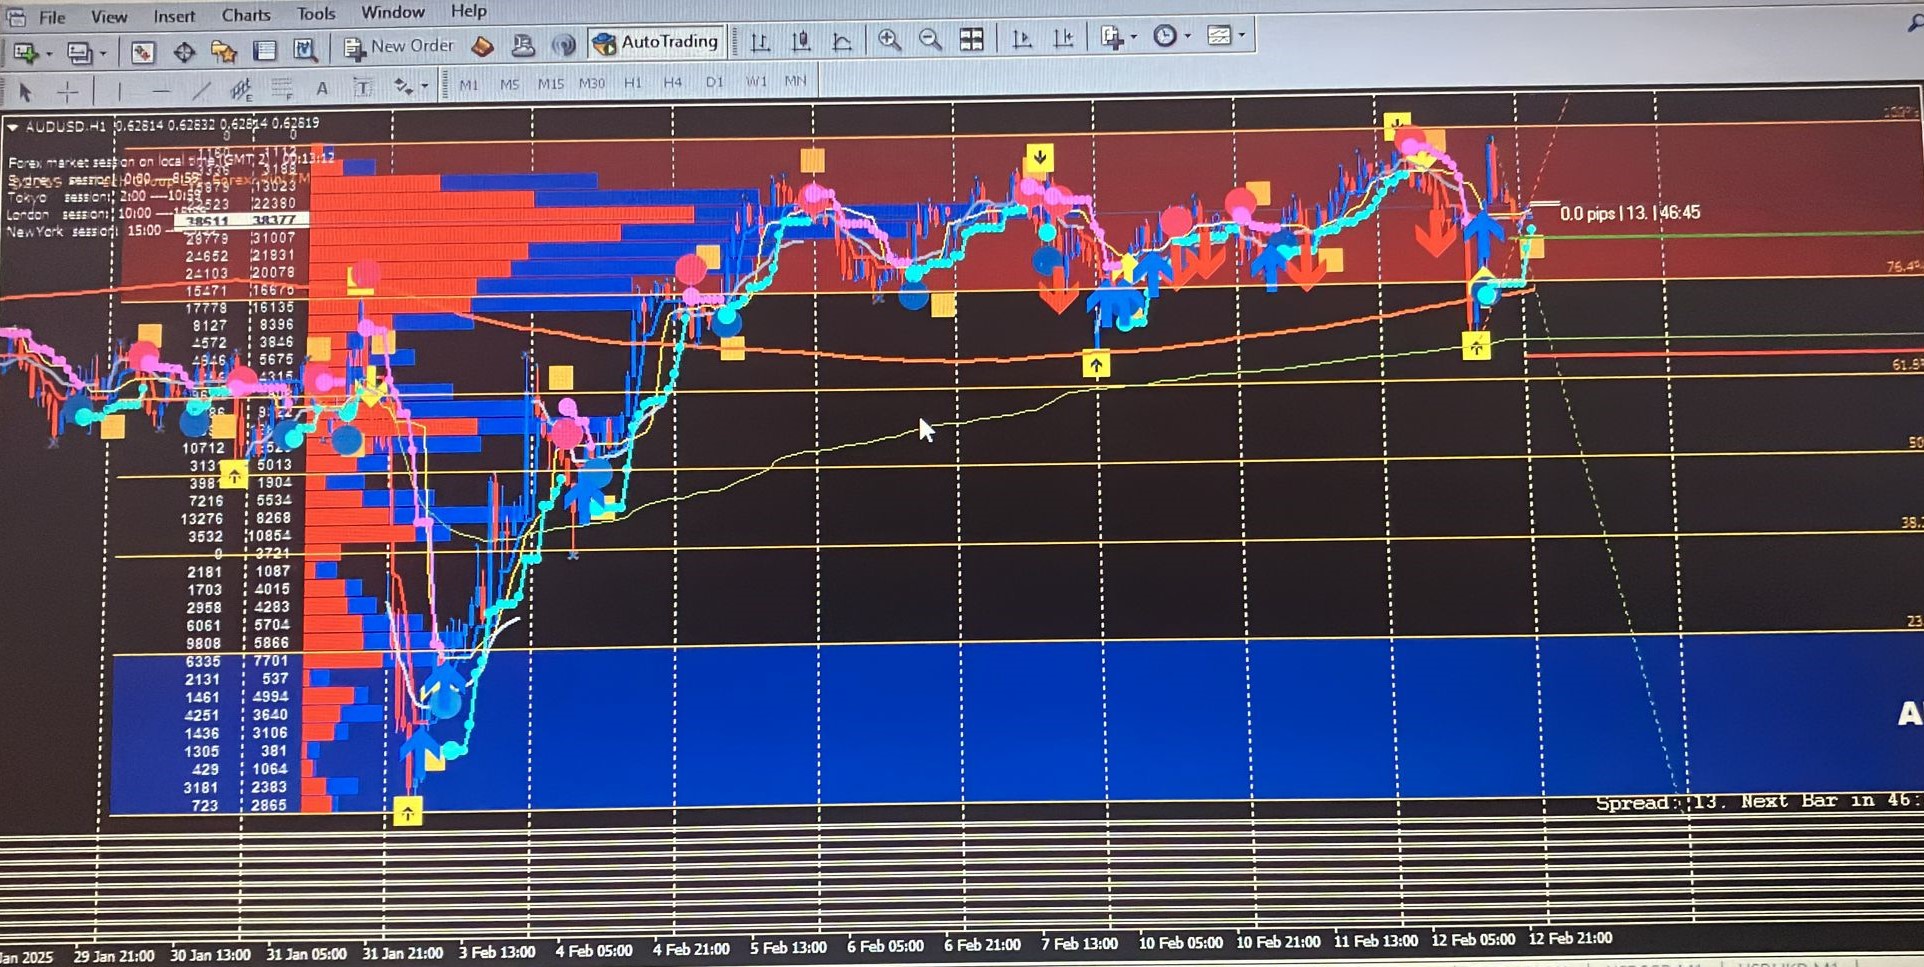
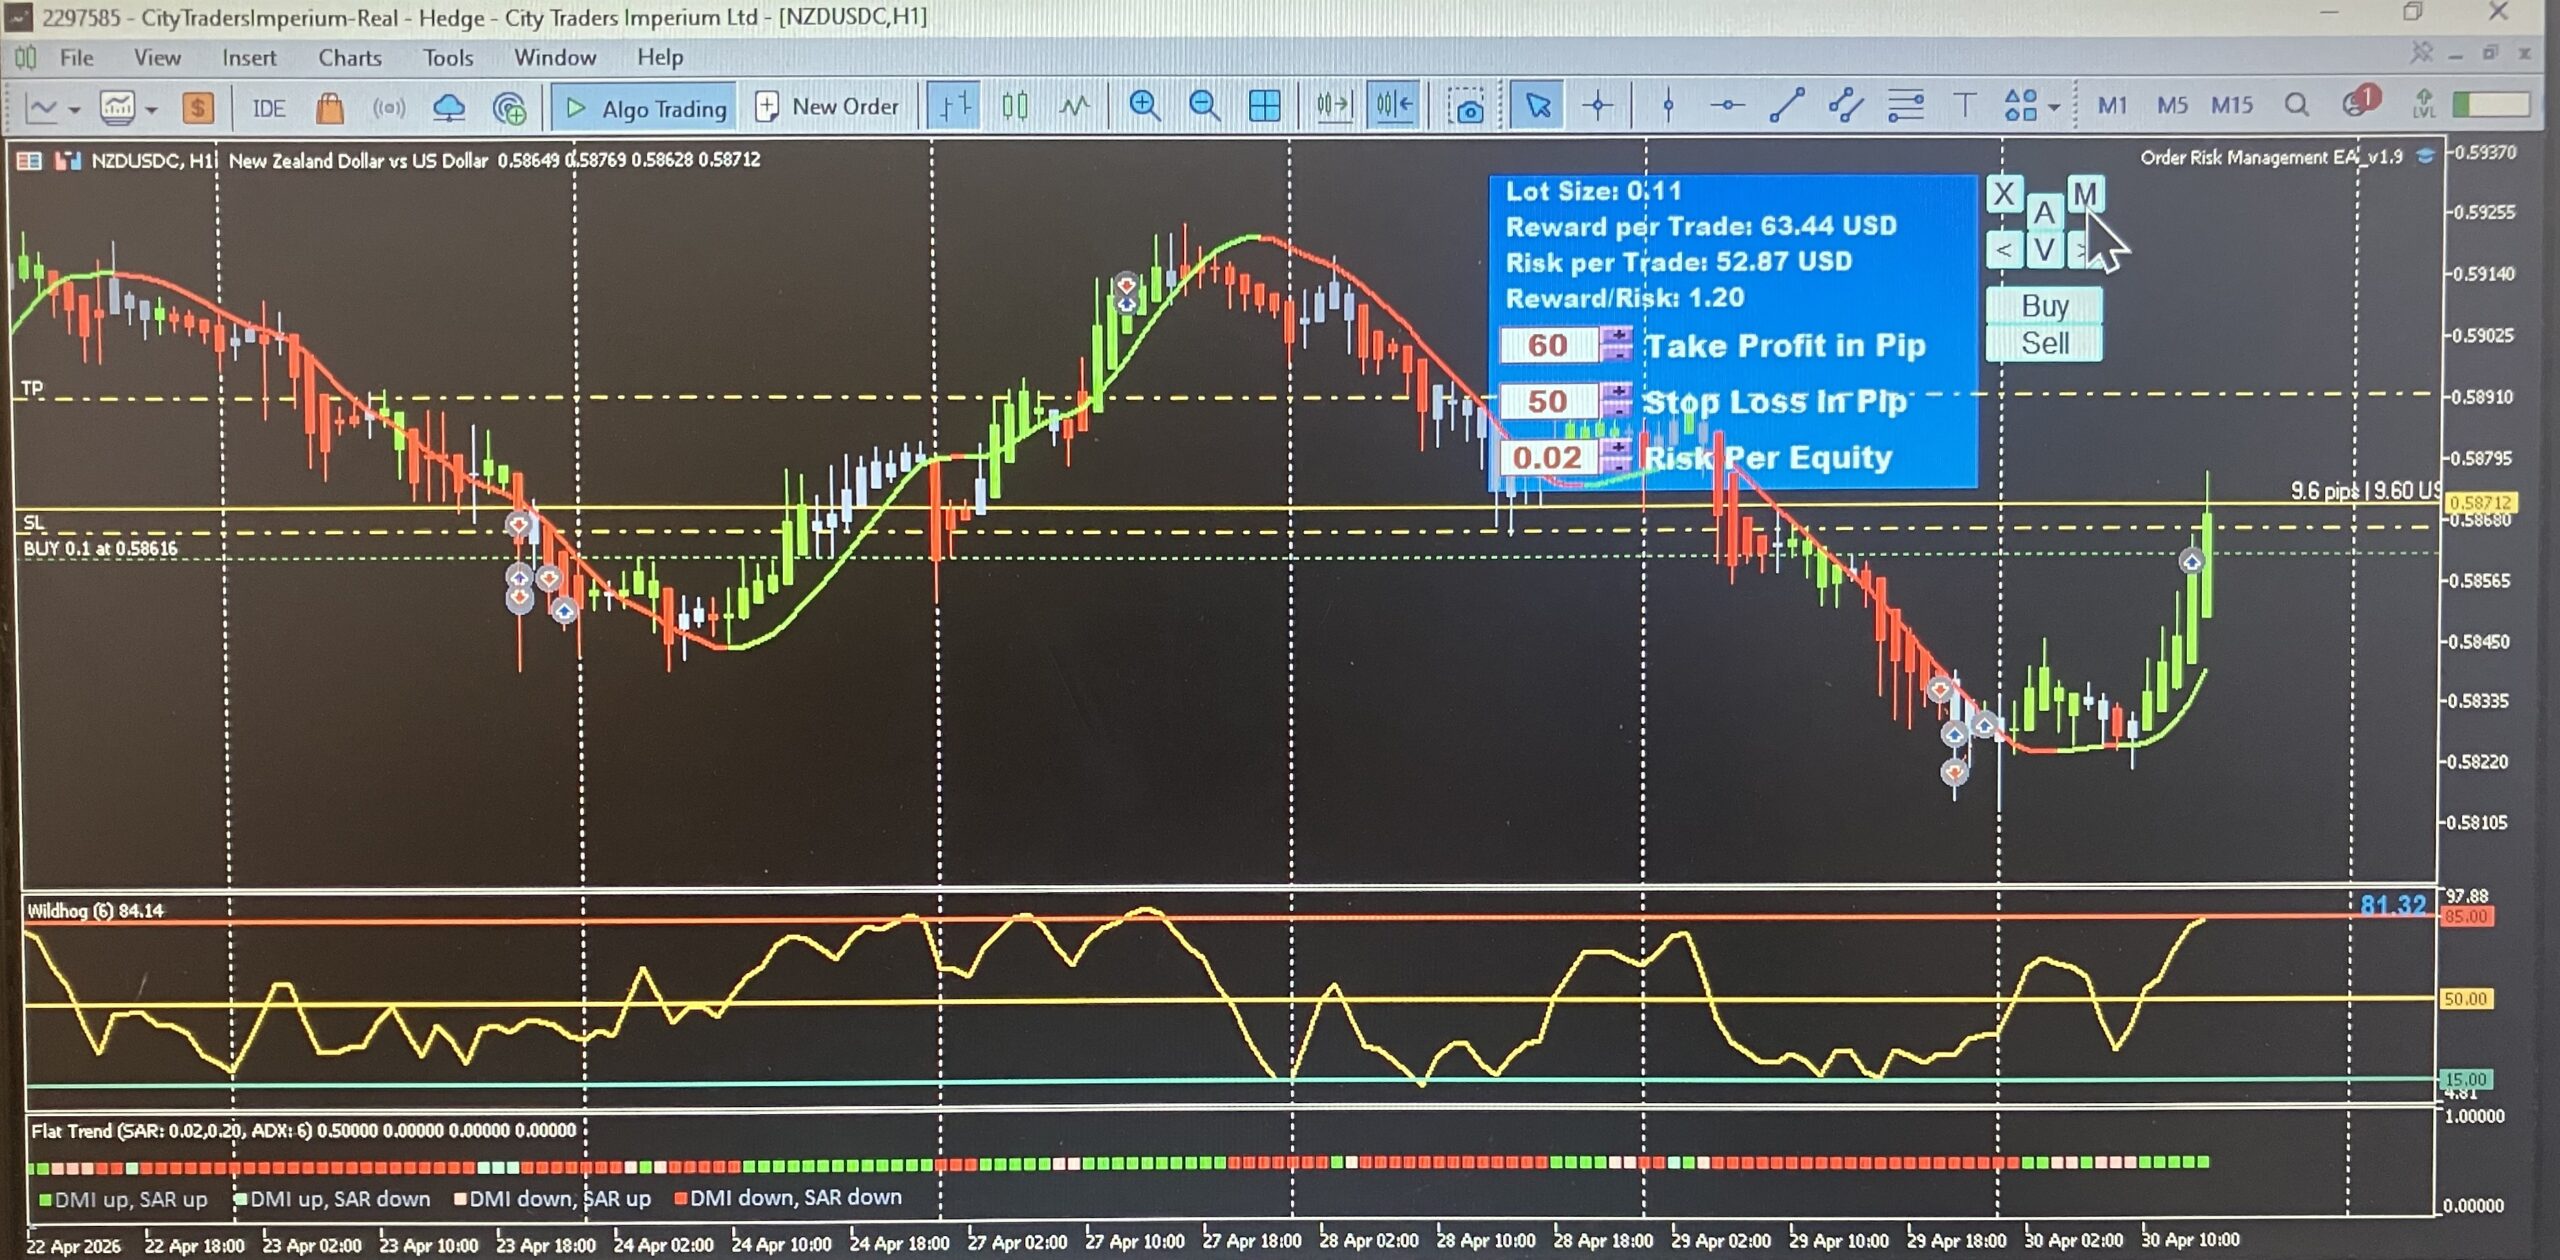
Look at all the pictures below to see some of the hundreds of indicators I have looked at, primarily on MetaTrader 4 and 5. Once I worked it out for these two, it was easier to build it in cTrader and TradingView.

My trading journey and the things I have looked at and studied:
2009: I went to a workshop/talk about trading with a really hard, almost manipulative sell at a trading centre in Fulham, UK
2017: I didn’t pursue trading after 2009, but in 2017 a work colleague introduced me to the now defunct iMarketsLive. Even though they were shut down, I still learned the basics of trading with them. The same colleague also introduced me to MELiUS, which was shut down for its Multi-Level Marketing system; that said, I still learned a lot about the basics of trading with them, too.
2019: I came across the work of Dennis Buchholz and his Agimat system, which has now been discontinued but is free on certain websites. Even though I didn’t make much profit with it, I began learning how to build trading systems and even more about trading in general. I placed my first live trade in March 2019.
You can see some old videos on the Agimat system plus some trading education in this old blog post.
2025: I found out about Cynthia Macy and her colour-coded trading systems. That year, I also looked into Greg Secker’s work at the Learn To Trade Group and the Smart Charts software they developed. I went to one of their £30 introductory workshops and learnt a bit more about other trading strategies, but didnt sign up for their trading mentoring and software, which started at around £2000 (when I was there) and went up to £20,000, according to this complaint!
This year, I also came across Altra Forex trading systems for MetaTrader 4 and 5. I bought two of the systems to test them out, but by that point I had my systems pretty much built. I wanted to see how he did it and how they worked.
He also has loads of free MT4 and MT5 indicators there that you can download. I use one of them on my MT4 system
2026: I found out about the Trading College and their colour-coded trading system.
More resources I have looked at and used (or still use)
Books:
Trading in the Zone by Mark Douglas
The Mental Game of Trading by Jared Tendler
One Trade A Day Habit by Greg Secker
Online Courses:
What is Forex Trading (for Beginners)
Podcasts/YouTube channels:
Webinars:
Trading College: The Colour Method in Action
Tools:
Tax rules if you are based in the UK (Like I am)